Why reliability and communication matter more than anything people usually measure.
Most people don’t expect much from elevator service.
Not because they don’t care. Because over time, the bar gets set by experience. Calls go unreturned. Timelines stay vague. Explanations are either too technical or not given at all. And eventually, that becomes normal.
So when something actually works the way it should, it feels notable. It probably shouldn’t. But it does.
The Expectation Problem
We hear a version of the same thing from building managers and homeowners alike. By the time they call us, they’ve usually already adjusted to a lower standard. They’re not expecting great service. They’re hoping for adequate.
That’s not a small thing. When expectations have been worn down enough, people stop asking for what they actually need. They accept vague timelines because they’ve learned that pushing back doesn’t help. They stop calling because nobody picks up anyway.
The problem isn’t just poor service. It’s what poor service does to the relationship over time.
What People Actually Remember
Nobody remembers the service ticket number.
They remember whether the elevator was working on a Monday morning when the building was full. They remember whether someone picked up when they called. They remember whether they got a straight answer or a runaround.
We’ve talked to property managers who couldn’t tell us the last time their service provider proactively reached out about anything. Not a heads up before a scheduled repair. Not a follow up after a recurring issue. Nothing. The relationship only existed when something broke.
That’s reactive service. And most people in commercial buildings and residential homes have experienced this.
What Good Actually Looks Like
Good service isn’t perfect service. Equipment breaks. Things happen. That’s not the standard.
The standard is predictability. Knowing who to call and having them answer. Getting a clear explanation of what happened and what’s being done about it. Having issues addressed before they turn into emergencies.
It’s not dramatic. It doesn’t announce itself. But over time it changes how a building runs and how the people in it feel about the systems they depend on every day.
For a family with a home elevator, that predictability isn’t a convenience. It’s peace of mind. For a commercial building, it’s the difference between a minor inconvenience and a tenant relations problem.
Why it Feels Rare
Most service models are built to close tickets, not build relationships. The job is done when the repair is done. Whether the customer understands what happened, feels confident in the fix, or knows what to watch for next, that part is often left unaddressed.
So things happen to buildings instead of being managed for them. And the people relying on the equipment are left filling in the gaps themselves.
A Better Way to Think About It
Elevator service doesn’t have to feel like a constant question mark in the background.
When communication is consistent, when someone takes ownership, when the people relying on the equipment actually understand what’s being done and why, service stops being a source of anxiety and starts being something nobody has to think about.
That’s the standard worth holding. Not perfection. Just consistency, clarity, and someone who actually picks up the phone.
Most buildings and homes don’t need more service. They need better service. And once you know what that looks like, it’s a lot easier to see the gap between where things are and where they should be.
If your service still feels like a question mark, it’s worth taking a closer look. Give us a callor schedule a time to meet, and we’ll help you sort through what’s actually happening.
Most buildings track elevator data. Few use it to understand what’s actually changing.
Most buildings today are collecting more elevator data than ever before.
But very little of it is being used to its full potential.
Because most systems are designed to answer a simple question:
“Is something wrong?”
The more useful question is:
“What is this system trying to tell us before anything breaks?”
Not All Data Is Created Equal
When people think about elevator monitoring, they usually think in terms of failures:
A fault code triggers
A component stops working
An alert gets sent
That’s the obvious layer.
But underneath that is a much quieter—and far more valuable—set of signals:
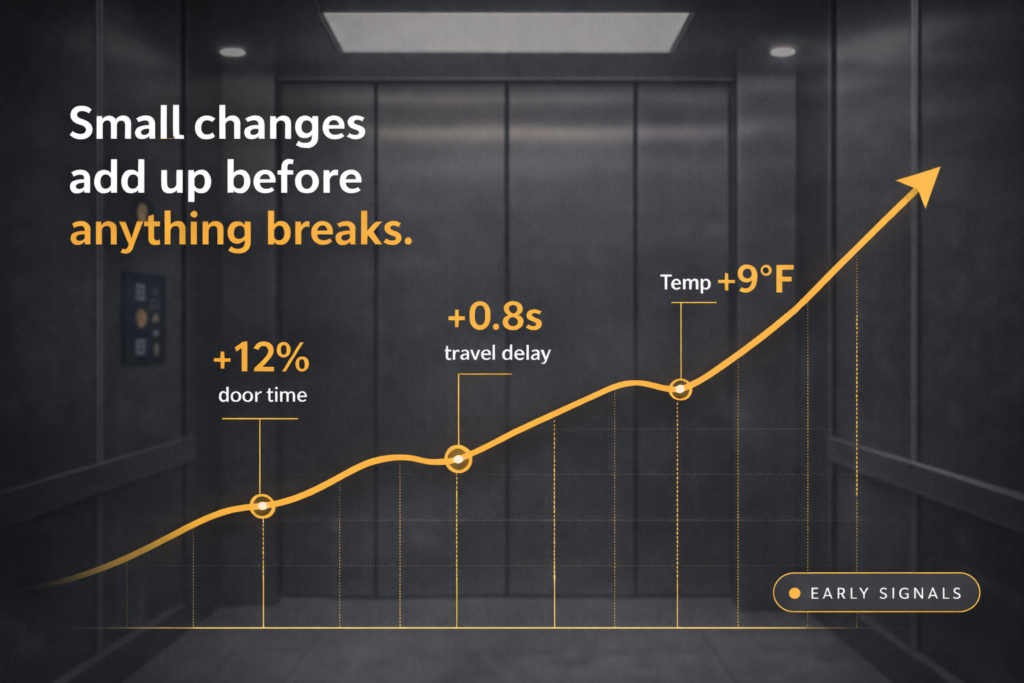
Slight increases in door dwell time
Small delays in floor-to-floor travel
Changes in motor temperature under similar load conditions
Irregular call patterns at certain times of day
Individually, none of these mean much.
But together, they start to form a pattern.
Patterns Show Up Long Before Problems Do
Most mechanical issues don’t appear suddenly.
They develop gradually.
A door operator doesn’t just fail—it starts closing a fraction of a second slower. A drive system doesn’t overheat instantly—it runs slightly warmer under the same demand.
Here’s what that can look like in real terms:
Door cycle time increases by 12–18% over 60 days → Early sign of operator wear or alignment issues
Average trip time between floors increases by ~0.5–1 second during peak hours → Could indicate load strain, dispatch inefficiency, or control system lag
Motor temperature trends 8–10°F higher under the same usage conditions → Often a precursor to premature component failure
Call volume spikes at consistent times (e.g., 8:45–9:15 AM) → Not a mechanical issue—but a traffic flow or scheduling bottleneck
None of these would typically trigger an urgent alert.
But they’re often the first indicators that something is drifting.
What Most Buildings Are Missing
Here’s the part that often goes overlooked:
Elevator data isn’t just about maintenance. It’s about behavior.
When you start looking at trends over time, you can begin to understand:
Which elevators are being overused—and when
Where traffic bottlenecks consistently form
Whether perceived “slowness” is mechanical or operational
How dispatch logic is actually performing in real-world conditions
In some cases, the issue isn’t the equipment at all.
It’s how the system is being used.
And without the data, those distinctions are almost impossible to make.
The Difference Between Activity and Insight
Most buildings already have activity:
Logs
Alerts
Monthly service reports
But insight requires something different.
It requires context.
Not just: “What happened?”
But:
Is this trend consistent or isolated?
How does this compare to the last 30, 60, 90 days?
Is this happening across all cars—or just one?
Does this pattern correlate with time of day or traffic load?
Without that layer, data becomes noise.
With it, it becomes direction.
How to Actually Use the Data (Without Overcomplicating It)
You don’t need a complex system to start getting value.
But you do need a more intentional way of looking at what you already have.
Here are a few practical ways to begin:
1. Track Trends, Not Just Events Instead of reviewing individual alerts, look at:
Door cycle times over time
Trip durations during peak vs off-peak
Repeated minor faults on the same component
Even a simple monthly comparison can reveal drift.
2. Review Data in 30–60–90 Day Windows Most issues don’t show up in a single report.
Looking at rolling timeframes helps you spot:
Gradual performance decline
Seasonal or usage-based patterns
Recurring “almost problems”
3. Separate Mechanical vs Usage Signals Not every issue is a repair issue.
Ask:
Is this tied to equipment…or traffic flow?
Is one elevator carrying more load than others?
Are peak-time delays predictable?
This can prevent unnecessary service calls—and uncover operational fixes instead.
4. Identify “Repeat Offenders” If the same car or component keeps showing minor irregularities, that’s often more telling than one major failure.
Small, repeated signals usually point to:
Early-stage wear
Misalignment
Or a system that’s compensating for something else
5. Ask for Context, Not Just Reports Most service reports tell you what happened.
Fewer explain what’s changing.
A better question to ask is:
“What are you seeing that isn’t a problem yet—but is trending that way?”
That’s where the real value lives.
Where This Changes Decision-Making
When data is interpreted correctly, it starts to shift how decisions are made.
Instead of reacting to failures, you start identifying:
Components that are wearing faster than expected
Systems under strain due to usage patterns
Opportunities to rebalance traffic or adjust performance
It also changes how you think about cost.
Because not all expenses are tied to breakdowns.
Some are tied to inefficiencies that go unnoticed for years.
The Bottom Line
Elevator systems are constantly communicating.
The question is whether anyone is actually listening beyond the obvious signals.
The real value of data isn’t in catching failures.
It’s in recognizing the patterns that lead to them—and the opportunities to improve before they ever show up.
A clearer, more responsive approach to elevator service—for homes, buildings, and the people who rely on them.
We didn’t set out to build just another elevator company.
We started Aspire Elevator because we kept seeing the same pattern—people weren’t frustrated with elevators themselves as much as they were frustrated with the experience around them.
Calls that didn’t get returned. Issues that took too long to resolve. Explanations that felt unclear or overly technical.
Over time, that becomes what people expect.
And most assume that’s just how it works.
But it doesn’t have to.
Where Most Frustration Starts
For most people, the challenge isn’t just the elevator.
It’s everything that surrounds it.
Elevators are essential systems—but they live in a space that’s highly technical and often reactive. You don’t think about them until something isn’t working the way it should.
And when that happens, you’re suddenly dealing with:
Downtime that impacts tenants, guests, or daily routines
Unclear communication around what’s wrong or how long it will take
Recommendations that are hard to evaluate without context
For hotels and office buildings, that affects experience and operations. For contractors, it can create delays and coordination issues. For homeowners, it disrupts the flow of daily life in a way most people don’t anticipate.
And in many cases, the hardest part isn’t the issue itself—it’s not knowing what’s actually going on.
The Assumption Most People Don’t Question
There’s a quiet assumption in this space:
That slow responses, limited communication, and reactive service are just part of owning or managing an elevator.
So people adjust.
They wait longer than they should. They move forward without full clarity. They accept a level of uncertainty that wouldn’t be acceptable in other areas of their home or business.
But that’s not a requirement of the system—it’s a result of how the system is often supported.
A Different Way to Approach Elevator Service
At Aspire Elevator, the goal isn’t just to fix what’s broken.
It’s to make the entire experience around your elevator feel more clear, responsive, and manageable.
That starts with something simple:
When you reach out, you get a response.
Not eventually—quickly.
But responsiveness alone isn’t enough.
It has to be paired with real skill and experience. The kind that allows you to not only address the issue in front of you, but also recognize patterns, anticipate future problems, and offer better long-term solutions.
Because not every elevator issue is just a one-time fix.
Sometimes the better question is:
Why does this keep happening?
Is there a more efficient path forward?
What can we do now to prevent this from becoming a bigger issue later?
That’s where thoughtful support makes a difference.
Why Education Matters
One of the biggest gaps we see is a lack of understanding around how elevators actually work—and what good service should look like.
Most people are given answers, but not context.
And without that context, it’s hard to know:
What’s necessary vs. optional
What’s urgent vs. something that can be planned
What a smart long-term investment looks like
We believe part of our role is helping you understand your system—not just respond to it.
Because when you understand what’s happening:
You make better decisions
You can plan instead of react
You avoid unnecessary costs and disruptions
And that changes everything.
Who We Work With
This shows up across a wide range of environments:
Hotels & Motels → where uptime directly impacts guest experience
Office Buildings → where reliability matters every single day
Contractors → who need clear communication and coordination
Homeowners → who want something that works seamlessly without constant concern
Different settings, but the same need underneath it:
Clear answers. Reliable support. People who actually show up.
What You Should Expect
If there’s one thing we hope people walk away with, it’s this:
You don’t have to settle for confusion or slow responses.
You should expect:
Clear communication
Timely support
Thoughtful recommendations
A partner who helps you think ahead—not just react
That shouldn’t be a differentiator.
It should be the baseline.
Let’s Talk
Whether you’re:
Trying to better understand how your current system works
Working through an issue that needs attention, or
Beginning to explore what adding an elevator to your home or building could look like
We’d be glad to walk through it with you.
A simple conversation to help you gain clarity on what makes the most sense moving forward.
Rethinking how residential elevators integrate into high-end home design
When someone walks into a luxury home, they’re not evaluating features right away.
They’re feeling something.
Before square footage, before finishes, before price—there’s an immediate sense of whether the home feels cohesive, intentional, and complete. And in that first impression, even small disruptions can stand out.
One of the most overlooked contributors to that feeling?
The residential elevator.
Too often treated as a utility, an elevator can either quietly reinforce the flow of a home—or interrupt it entirely. And today’s luxury buyer notices the difference.
It’s Not About the Elevator—It’s About the Flow
Luxury design has shifted.
It’s no longer about adding more—it’s about making everything work together. Clean sightlines, consistent materials, and thoughtful transitions define how a home feels.
An elevator sits right in the middle of that experience.
When it’s placed awkwardly, designed as an afterthought, or finished without regard to the surrounding space, it creates friction. A visual pause. A moment where the home stops feeling seamless.
But when it’s done right, it disappears into the rhythm of the home—or becomes a feature that enhances it.
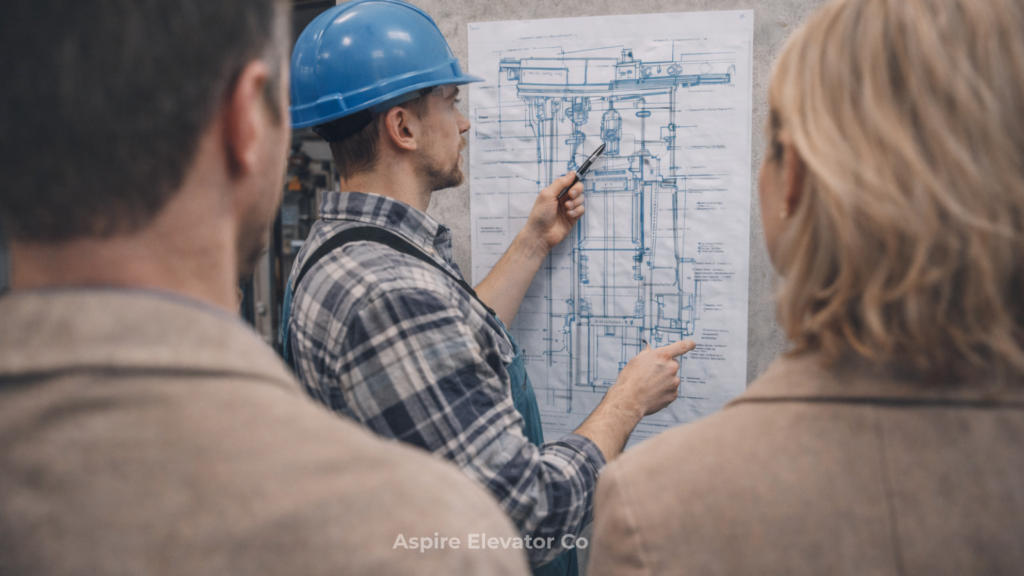
Where Placement Starts (And Why It Matters)
The biggest mistake isn’t how an elevator looks.
It’s when it’s considered too late.
In the strongest luxury builds, elevator placement is decided early—at the architectural level—because it impacts both flow and function across every floor.
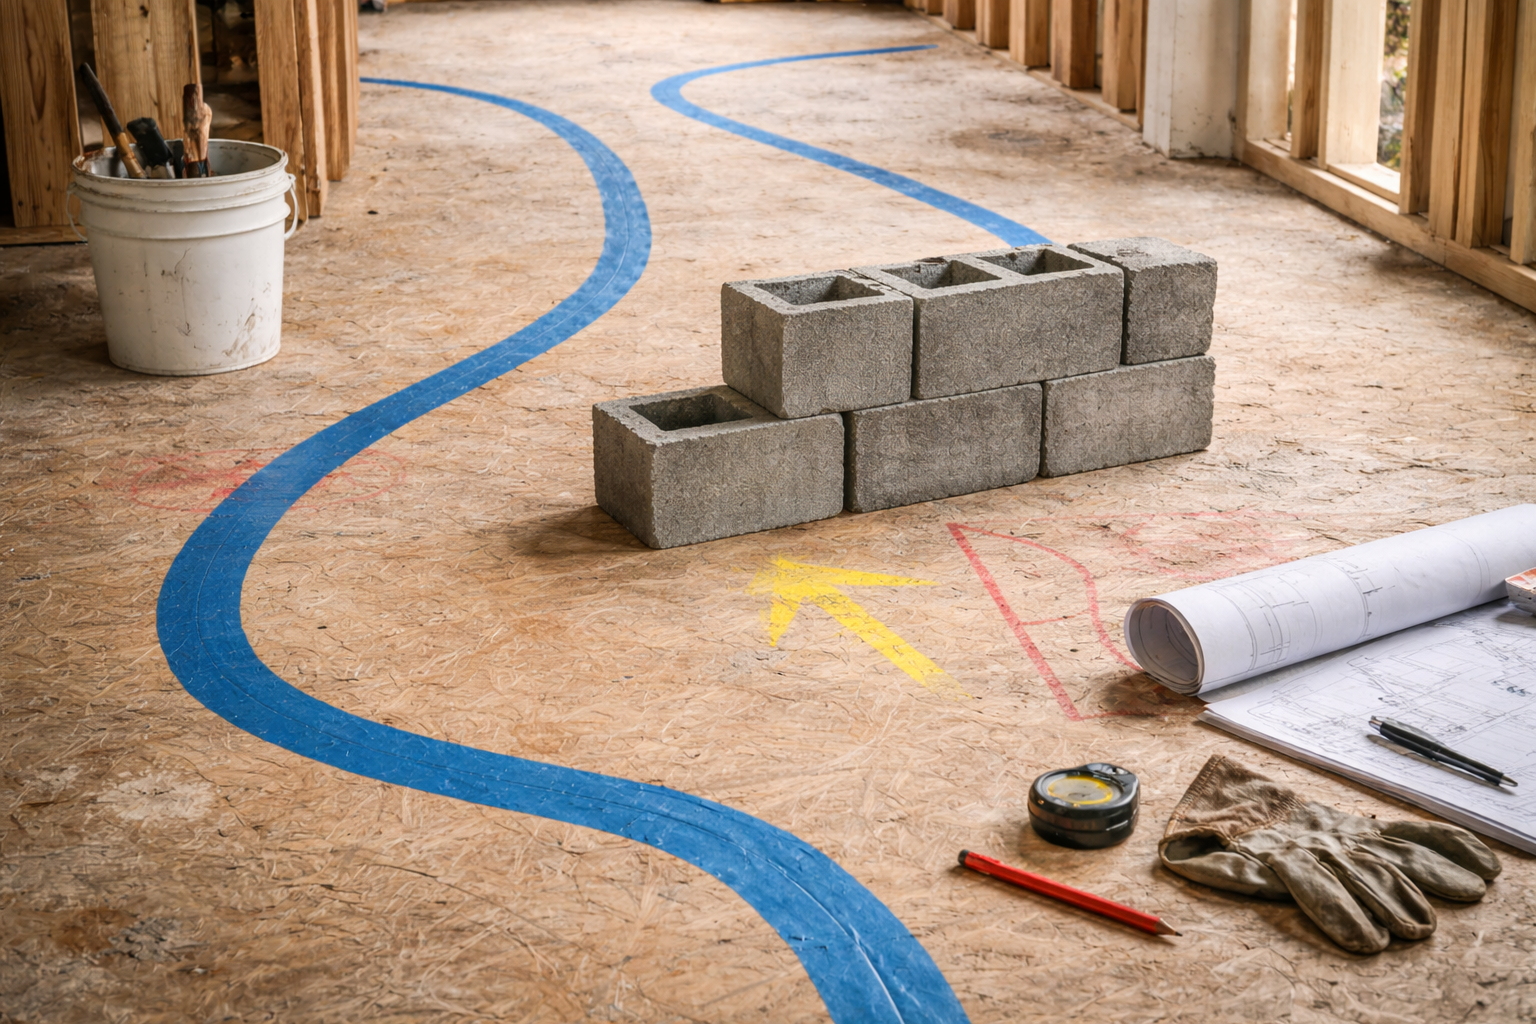
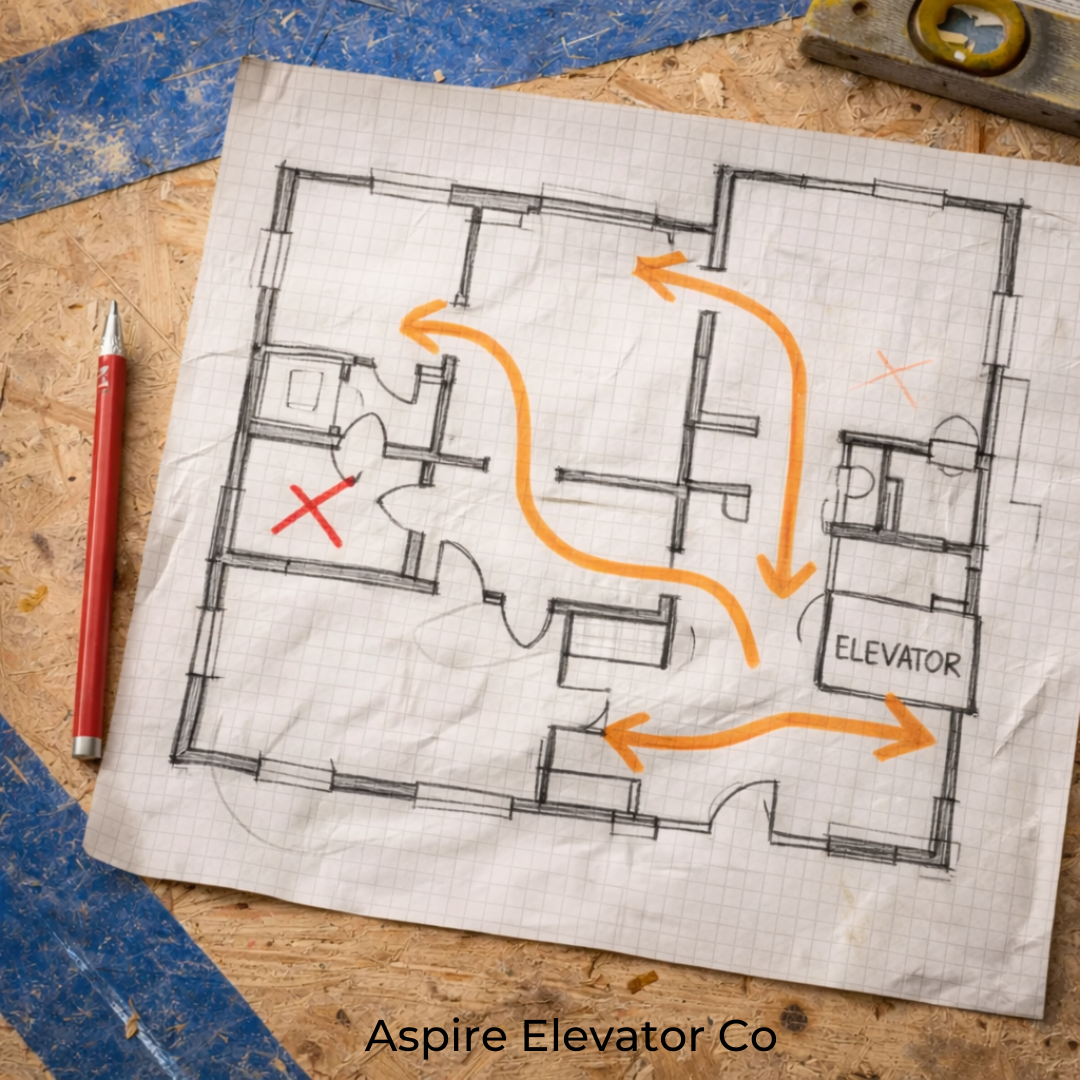
Thoughtful placement typically considers:
Natural traffic patterns The elevator should sit where movement already happens—not tucked away like a service element or forced into unused space.
Vertical alignment across floors Consistency matters. Misaligned landings or awkward entry points immediately signal poor planning.
Proximity to key living spaces Close enough to be convenient, but not intrusive to primary gathering areas.
Sightlines and first impressions What do you see when you walk in? If the elevator is visible, it needs to feel intentional—not accidental.
In coastal markets and multi-story homes especially, where elevators are often essential, placement isn’t just functional—it’s foundational to how the home is experienced.
How Designers Integrate Elevators (Step by Step)
Once placement is right, integration becomes the focus.
This is where luxury homes separate themselves—because the goal isn’t to “add” an elevator. It’s to make it feel like it was always part of the design.
Here’s how that’s done:
1. Align the Architecture
The elevator shaft and entry points are designed alongside the home—not retrofitted later. This ensures clean lines, balanced proportions, and consistent flow from floor to floor.
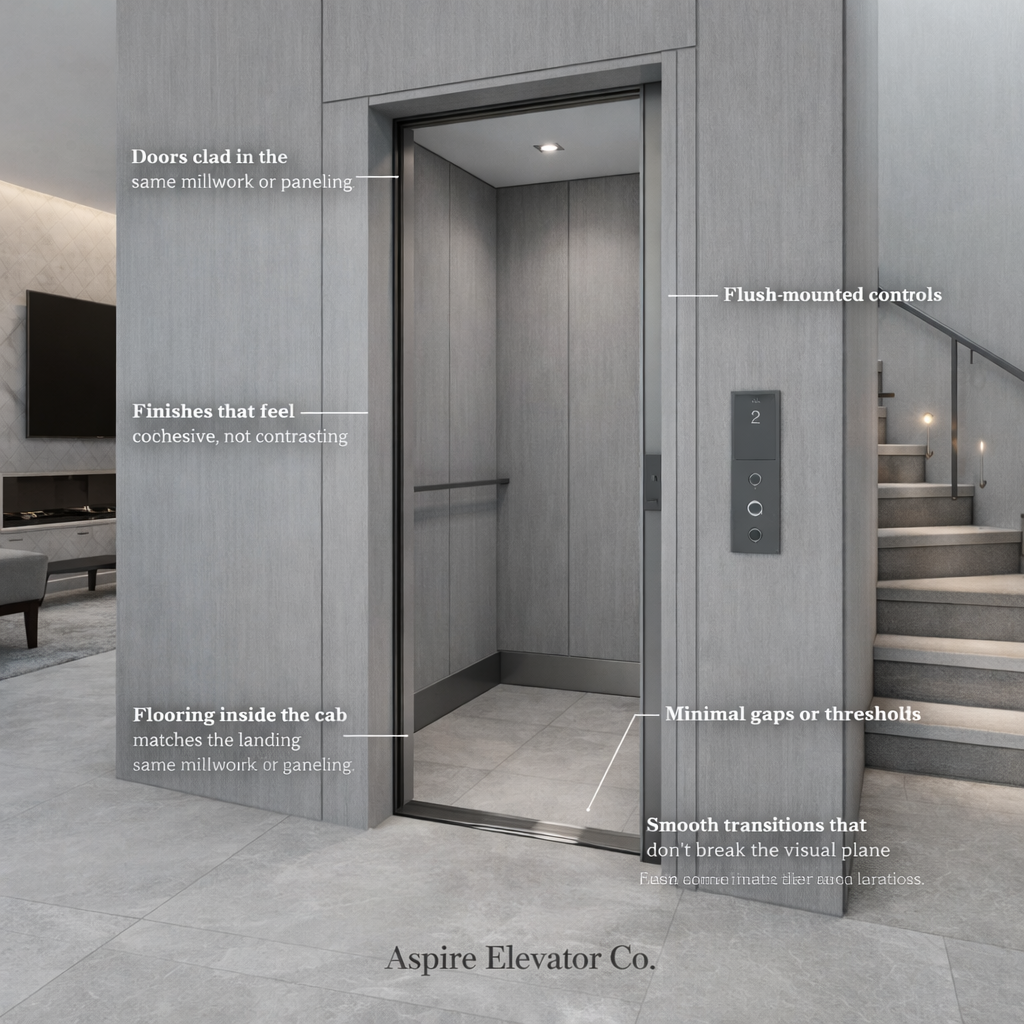
2. Match the Surrounding Materials
One of the most effective techniques is blending the elevator into the existing finishes:
Doors clad in the same millwork or paneling
Hardware that mirrors the home’s fixtures
Finishes that feel cohesive, not contrasting
Done well, the elevator can visually disappear into the wall.
3. Create Seamless Transitions
Details matter more than people realize:
Flooring inside the cab matches the landing
Minimal gaps or thresholds
Smooth transitions that don’t break the visual plane
These small choices reinforce continuity throughout the home.
4. Simplify the Interface
Luxury today leans minimal.
Bulky buttons and industrial panels are replaced with:
Flush-mounted controls
Touch interfaces
Custom metal finishes that align with lighting and hardware
Nothing should feel out of place.
5. Refine the Experience
What buyers feel matters just as much as what they see.
Quiet, smooth movement
Soft door operation
No vibration or mechanical noise
Because the moment something feels “mechanical,” the illusion of luxury breaks.
Invisible or Iconic—But Never Accidental
The best-designed homes take a clear stance:
Seamless (Invisible)
The elevator blends completely into the architecture—hidden in plain sight through matched finishes and minimal detailing.
Statement (Iconic)
Or, it becomes a focal point:
Glass enclosures
Custom lighting
Sculptural placement within staircases or atriums
Both approaches work.
What doesn’t work is indecision—when the elevator feels like it was added without a clear design intent.
Why Buyers Are Paying Attention Now
Luxury buyers today are more design-aware than ever.
They notice:
Consistency in materials
Flow between spaces
Whether every detail feels considered
And while they may not immediately call out the elevator, they will absolutely feel when something is off.
In a market where perception drives value, that matters.
The Takeaway
The first impression of a luxury home isn’t built on a single feature.
It’s built on how everything works together.
An elevator may not be the focal point—but it plays a critical role in whether a home feels complete. When it’s placed thoughtfully and integrated from the start, it becomes part of the home’s rhythm.
And when that happens, buyers don’t notice the elevator itself.
They just know the home feels right.
If you’re planning a new build or refining an existing home, elevator design should be part of the conversation early—not an afterthought.
At Aspire Elevator, we work alongside architects, builders, and homeowners to ensure every detail feels intentional from the start.
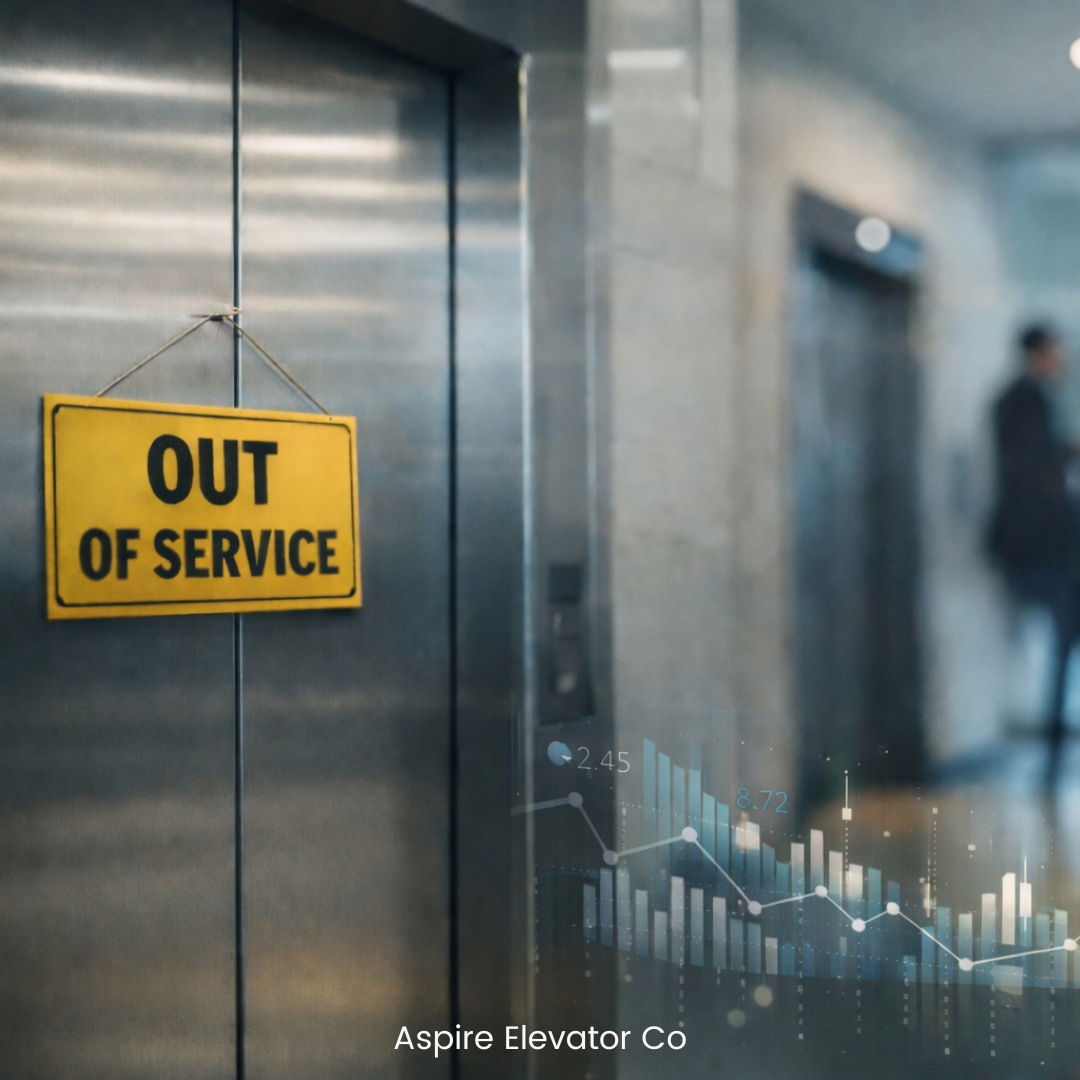
For most commercial properties, an elevator being out of service is treated as a temporary inconvenience.
But in reality, elevator downtime is rarely just a maintenance issue. It’s an operational disruption that creates costs across multiple parts of a property’s ecosystem.
The challenge is that many of these costs don’t appear on a maintenance invoice. They show up in tenant frustration, operational delays, and long-term asset perception.
When property managers begin to quantify these impacts, elevator uptime becomes less about fixing problems and more about protecting the performance of the entire building.
Why Elevator Downtime Is More Expensive Than It Looks
Most building owners evaluate downtime in simple terms:
Repair cost + technician labor.
But the broader financial picture is usually much larger.
When elevators stop operating, they can trigger:
Tenant productivity disruptions
Increased wait times during peak hours
Service delays for deliveries and vendors
Accessibility challenges for certain occupants
Higher pressure on remaining elevators
In multi-tenant buildings, the ripple effects can impact dozens or even hundreds of occupants at once.
And when downtime becomes frequent or unpredictable, it begins to affect how tenants perceive the reliability of the entire property.
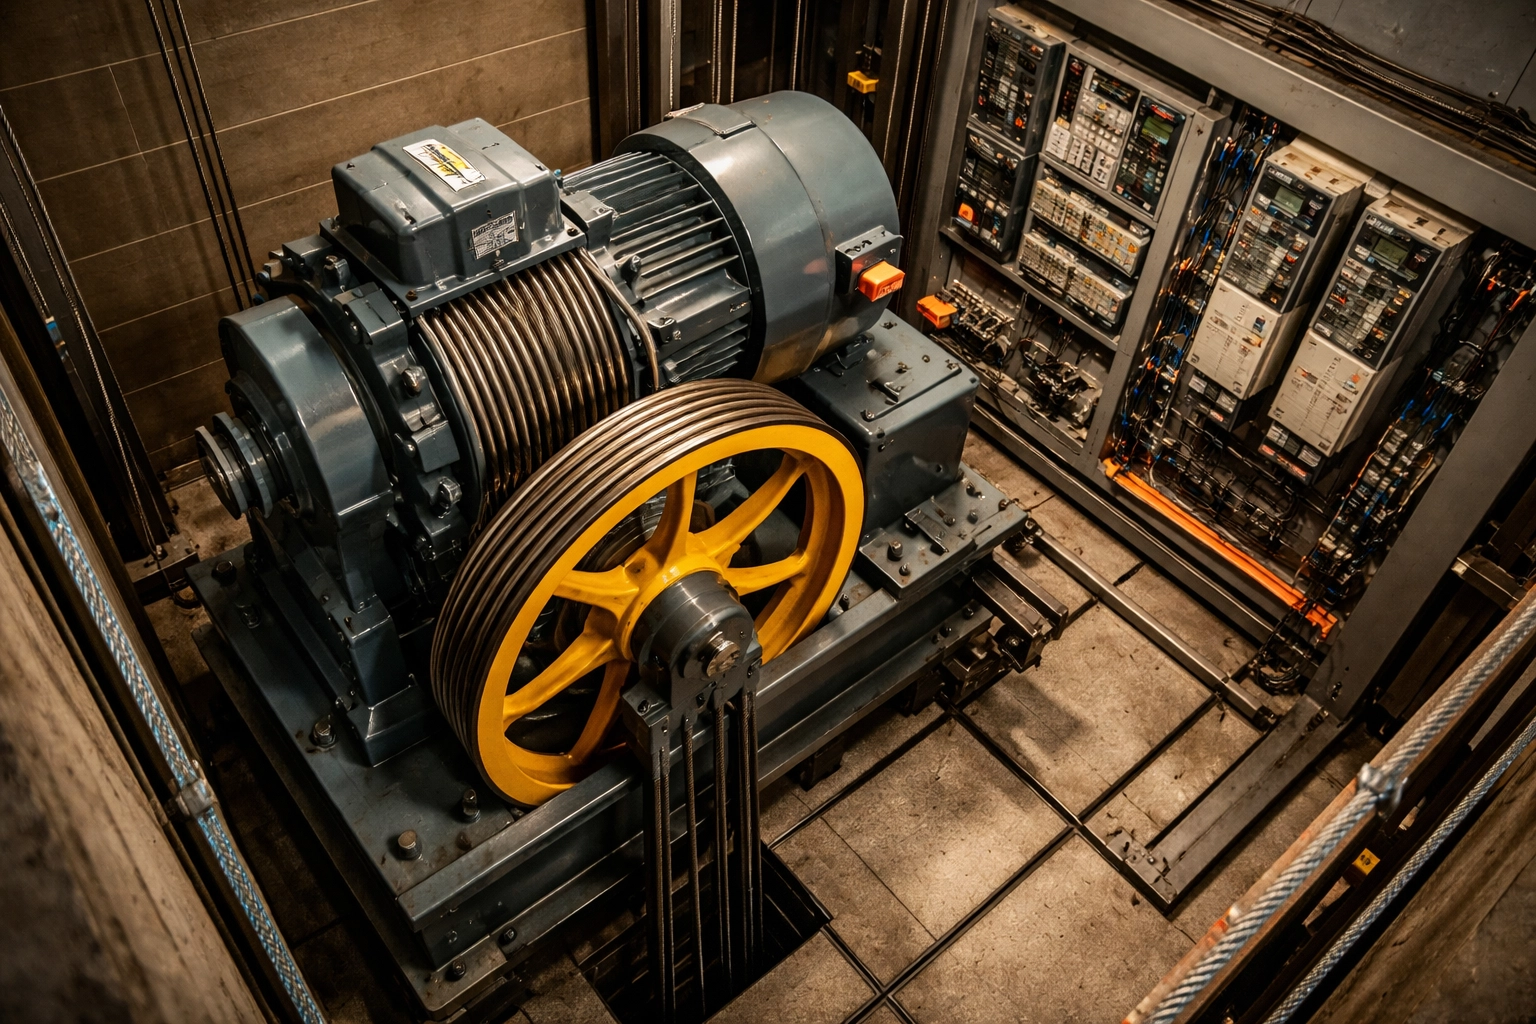
The Operational Ripple Effect
Elevators function as circulatory systems within commercial buildings.
When one unit goes down, the system rarely stops completely. Instead, the remaining elevators absorb the load.
That often results in:
Longer wait times
Congestion during peak hours
Reduced efficiency moving tenants throughout the building
In high-traffic environments, even a single elevator outage can shift traffic patterns across the entire building.
What looks like a short interruption can quietly become a daily operational bottleneck.
Quantifying the Hidden Costs
To understand the real impact of elevator downtime, it helps to look beyond repair invoices and examine operational metrics.
Property managers can begin estimating costs through a few key factors.
1. Tenant Time Loss
If a building houses 500 tenants and elevator wait times increase by just 3 minutes per trip, the cumulative productivity impact can add up quickly.
Even small delays across hundreds of daily elevator trips can translate into significant lost time over the course of a year.
2. Service and Delivery Delays
Service vendors, maintenance teams, and deliveries all rely on elevators to move efficiently through a building.
Downtime can slow these operations and create compounding delays across multiple services.
3. Tenant Satisfaction and Retention
While difficult to measure directly, building reliability plays a significant role in how tenants evaluate their space.
Frequent elevator outages can quietly influence:
Tenant renewal decisions
Property reputation
Overall tenant experience
In competitive leasing markets, operational reliability often becomes a differentiating factor.
Why Downtime Often Goes Unnoticed Until It’s Frequent
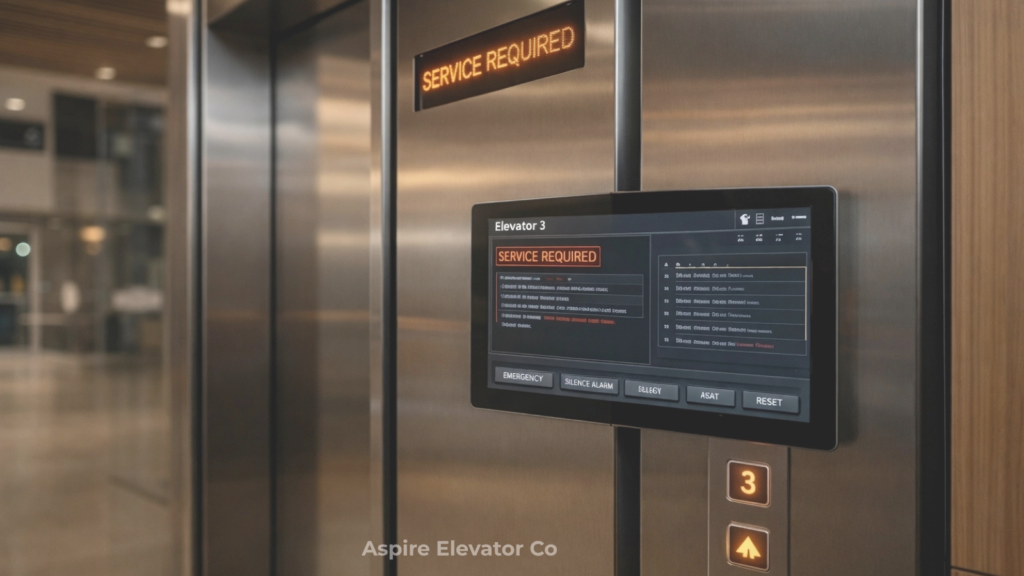
One reason these costs stay hidden is that downtime is often reactive rather than tracked strategically.
Elevators are repaired when they fail, and operations resume shortly after.
But without tracking patterns, it can be difficult to identify:
Recurring equipment issues
Increasing downtime frequency
System performance trends over time
This is where modern elevator monitoring systems are beginning to change how buildings manage vertical transportation.
Instead of reacting to failures, monitoring tools can help property managers:
Identify early warning signs
Track system performance
Reduce unplanned outages
Make more informed maintenance decisions
The goal is not simply faster repairs. It’s fewer disruptions overall.
From Reactive Repairs to Strategic Asset Management
Elevators are long-life assets that play a central role in how a building operates.
When downtime is viewed only as a repair issue, opportunities to improve reliability can be missed.
But when it’s evaluated through an operational lens, elevators become part of a broader strategy focused on:
Tenant experience
Building efficiency
Long-term asset planning
For many commercial properties, the most effective approach is shifting from reactive service calls toward data-driven monitoring and preventative maintenance.
Because the true cost of downtime isn’t just fixing an elevator.
It’s everything that happens while the building waits for it to come back online.
Want to reduce unexpected elevator downtime?
Aspire Elevator Co helps property owners and managers improve elevator reliability through monitoring, preventative maintenance planning, and long-term asset strategy.
Contact our team to learn how we can help keep your building moving.
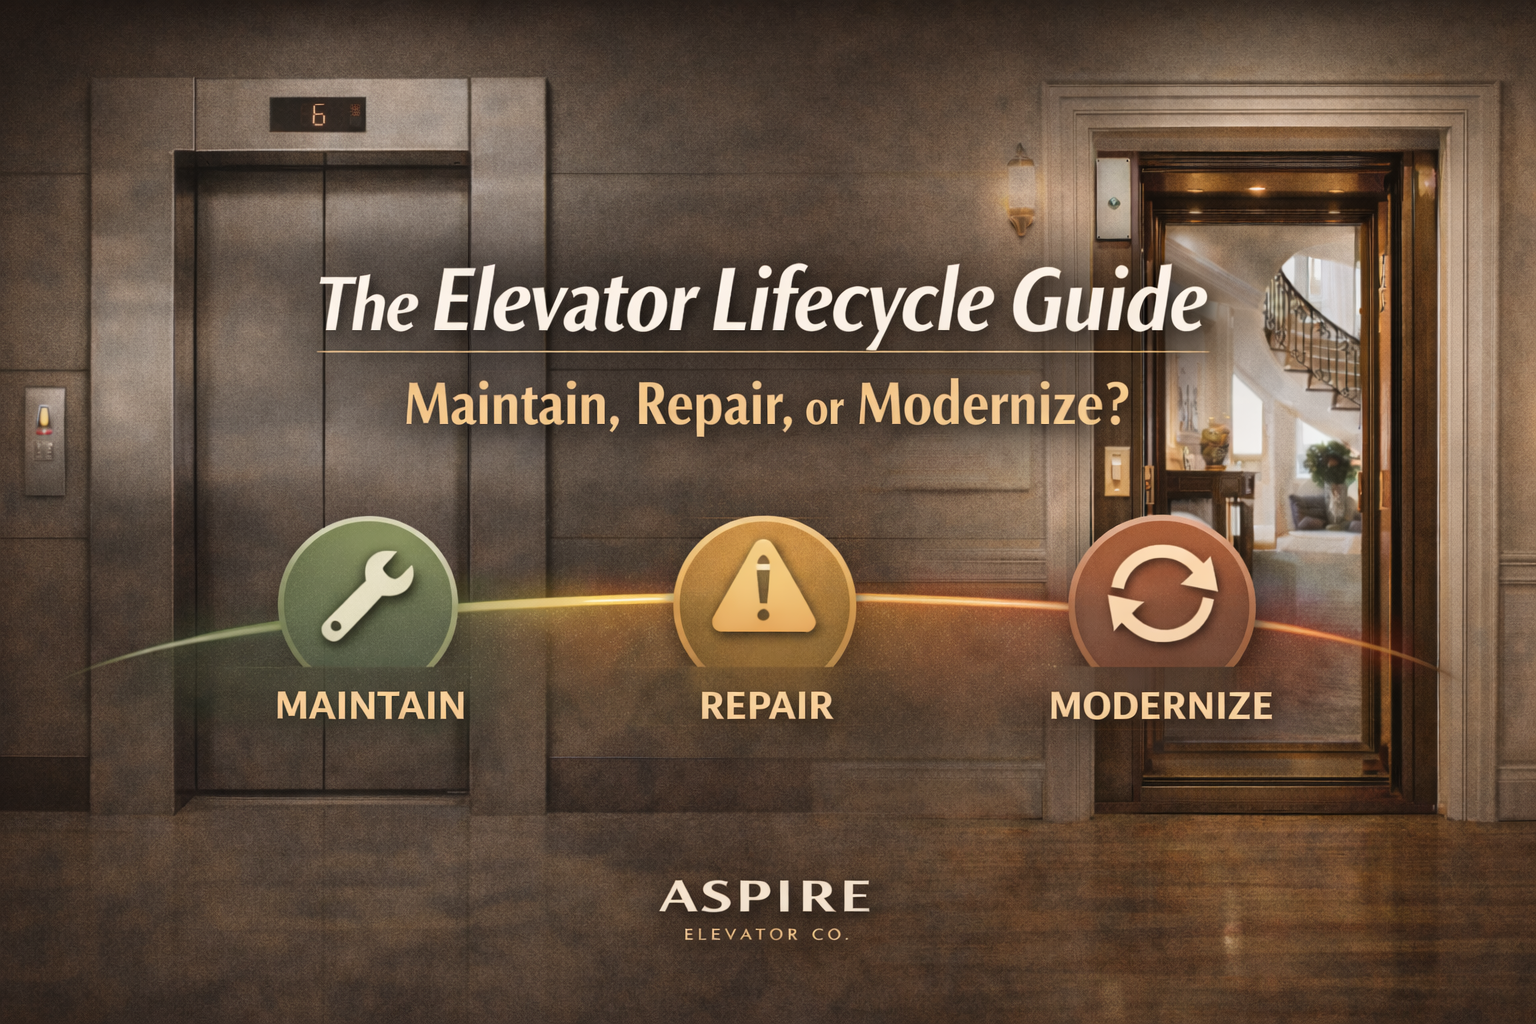
Elevators don’t fail overnight. They age in stages.
Whether you manage commercial elevators or own a residential elevator at home, the biggest financial mistake isn’t wear and tear, it’s making the wrong decision at the wrong time.
Should you continue routine elevator maintenance? Is it time for targeted repairs? Or are you overdue for elevator modernization?
This lifecycle playbook will help you decide.
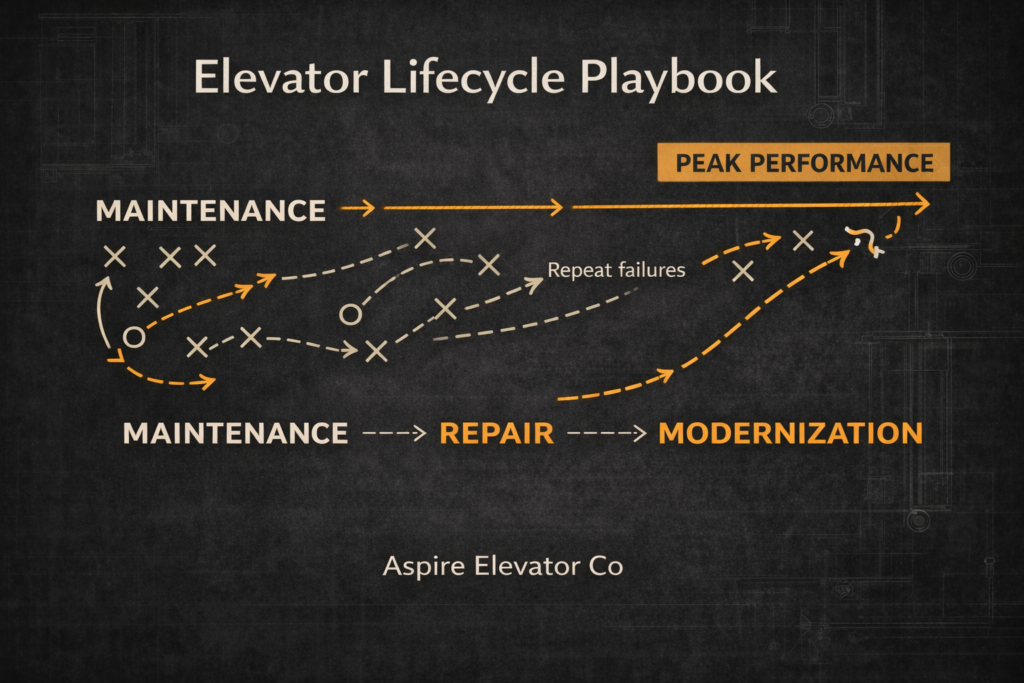
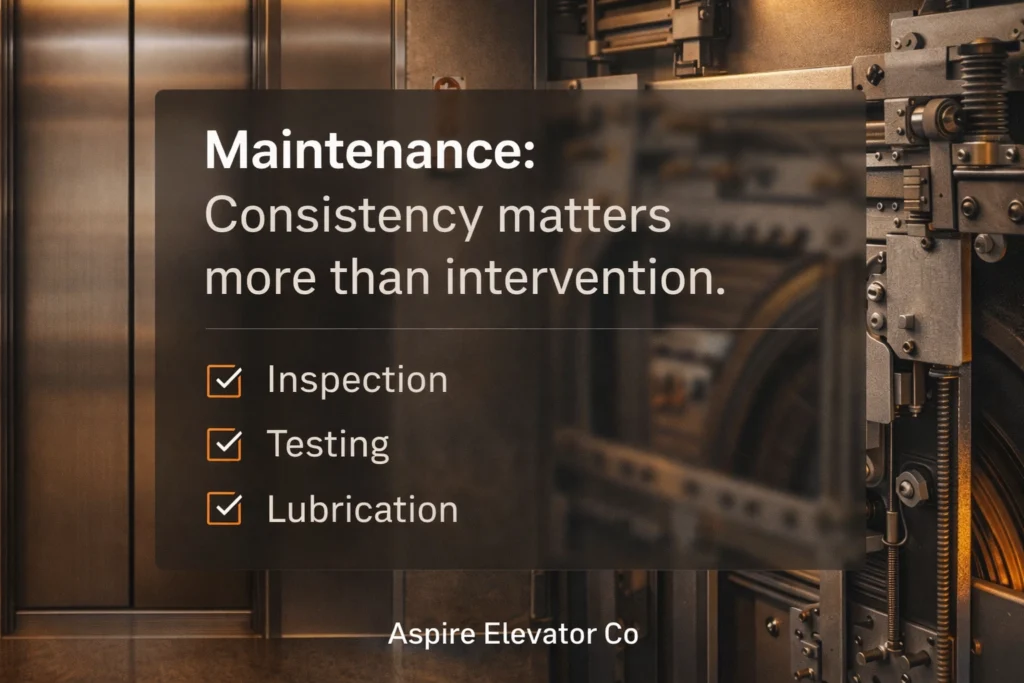
Stage 1: Elevator Maintenance- Protecting What Works
In the early and mid-life stages, most elevators don’t need major upgrades. They need consistent, proactive elevator maintenance.
Routine maintenance helps:
Extend equipment lifespan
Prevent premature component failure
Reduce downtime
Improve passenger safety
Keep inspections clean and predictable
For commercial elevators, strong maintenance programs protect tenant experience and building reputation. For residential elevators, maintenance preserves quiet operation, accessibility, and long-term home value.
You are likely in the maintenance phase if:
Your elevator passes inspections without recurring violations
Downtime is rare
Emergency service calls are minimal
The system is under 10–15 years old
At this stage, consistency matters more than intervention.
Stage 2: Elevator Repair- Solving Problems Without Overspending
All elevator systems require repairs over time. Components wear out. Usage increases. Technology evolves.
The key question is not whether to repair. It’s how often.
You may be entering a repair-heavy phase if:
The same parts are replaced repeatedly
Emergency calls are increasing
Downtime is disrupting tenants or daily living
Parts are harder to source
Annual repair costs are climbing
For commercial buildings, frequent elevator repairs affect tenant satisfaction, lease renewals, online reviews, and overall asset perception.
For residential elevators, repeated breakdowns reduce daily convenience, accessibility confidence, and buyer appeal if the home goes on the market.
When repair costs rise steadily, it may signal that modernization should be evaluated.
Stage 3: Elevator Modernization- Resetting the System for Long-Term Performance
Elevator modernization is not just cosmetic. It is a strategic investment in reliability, safety, and long-term cost control.
Modernization can include:
Control system upgrades
Door operator replacement
Drive and motor improvements
Safety code compliance updates
Interior enhancements for residential systems
Signs it may be time to modernize:
The elevator is 20+ years old
Repair costs exceed 25–40% of modernization cost
Downtime is increasing
Technology is outdated or unsupported
Energy efficiency is below current standards
For commercial properties, elevator modernization can reduce operating costs, improve uptime, support tenant retention, and strengthen property value.
For residential elevators, modernization can improve accessibility and aging-in-place functionality, increase buyer appeal, and support higher resale value.
In multi-level homes, especially luxury properties, a well-maintained and modern home elevator can significantly influence purchasing decisions. Accessibility is no longer a niche feature, it’s a long-term value driver.
Maintenance vs. Repair vs. Modernization: A Practical Comparison
The most expensive decision is often delayed modernization.
Waiting too long can result in major component failures, emergency replacements, extended downtime, and higher total lifecycle costs.
Commercial and Residential Elevators: Different Use, Same Lifecycle Strategy
Commercial elevators experience:
Higher traffic
Revenue-sensitive downtime
Strict compliance requirements
Tenant-driven expectations
Residential elevators focus on:
Accessibility
Daily convenience
Aging-in-place planning
Home resale value
Despite different usage patterns, both follow the same lifecycle logic: maintain early, repair strategically, modernize when performance and economics align.
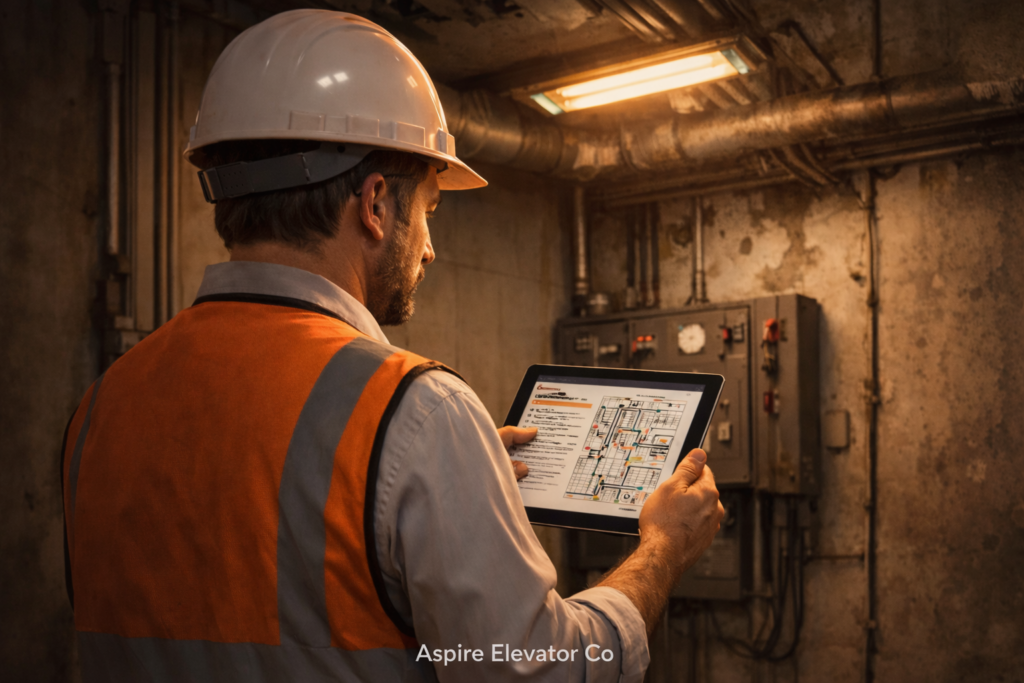
Using Data to Make Smarter Elevator Decisions
Modern elevator systems and monitoring technology allow owners to track usage frequency, component stress, failure trends, and downtime patterns.
Predictive insights help shift decisions from reactive to planned.
That means:
Fewer emergency calls
More accurate budgeting
Better modernization timing
Whether managing commercial elevators or a residential lift, performance visibility reduces long-term risk.
The Better Question to Ask
Instead of asking: “Can we get one more year out of it?”
Ask: “What stage of the elevator lifecycle are we in?”
When you understand the stage, decisions become clearer. Costs become more predictable. And value is protected: not compromised.
Elevators Are Long-Term Assets
Elevators are infrastructure.
In commercial buildings, they influence tenant retention and asset value. In residential homes, they support accessibility, comfort, and resale potential.
Owners who manage elevators strategically don’t wait for failure. They plan by lifecycle.
Schedule a Lifecycle Evaluation
If you’re unsure whether your elevator is in a maintenance, repair, or modernization phase, Aspire Elevator can evaluate your system and provide a tailored recommendation.
The right decision at the right stage protects more than equipment. It protects long-term value.
Home renovations usually center on what’s visible. But some of the most impactful upgrades aren’t immediately obvious.
Residential elevators are a growing example. Once considered a niche feature, they’re now viewed as long-term investments that can shape a home’s flexibility, longevity, and market appeal.
If you’re sitting on a multi-story property in Florida, Georgia, or South Carolina and wondering how to stand out in increasingly competitive real estate markets, this might be the upgrade that changes everything.
Understanding the Real Value of Residential Elevator Installations
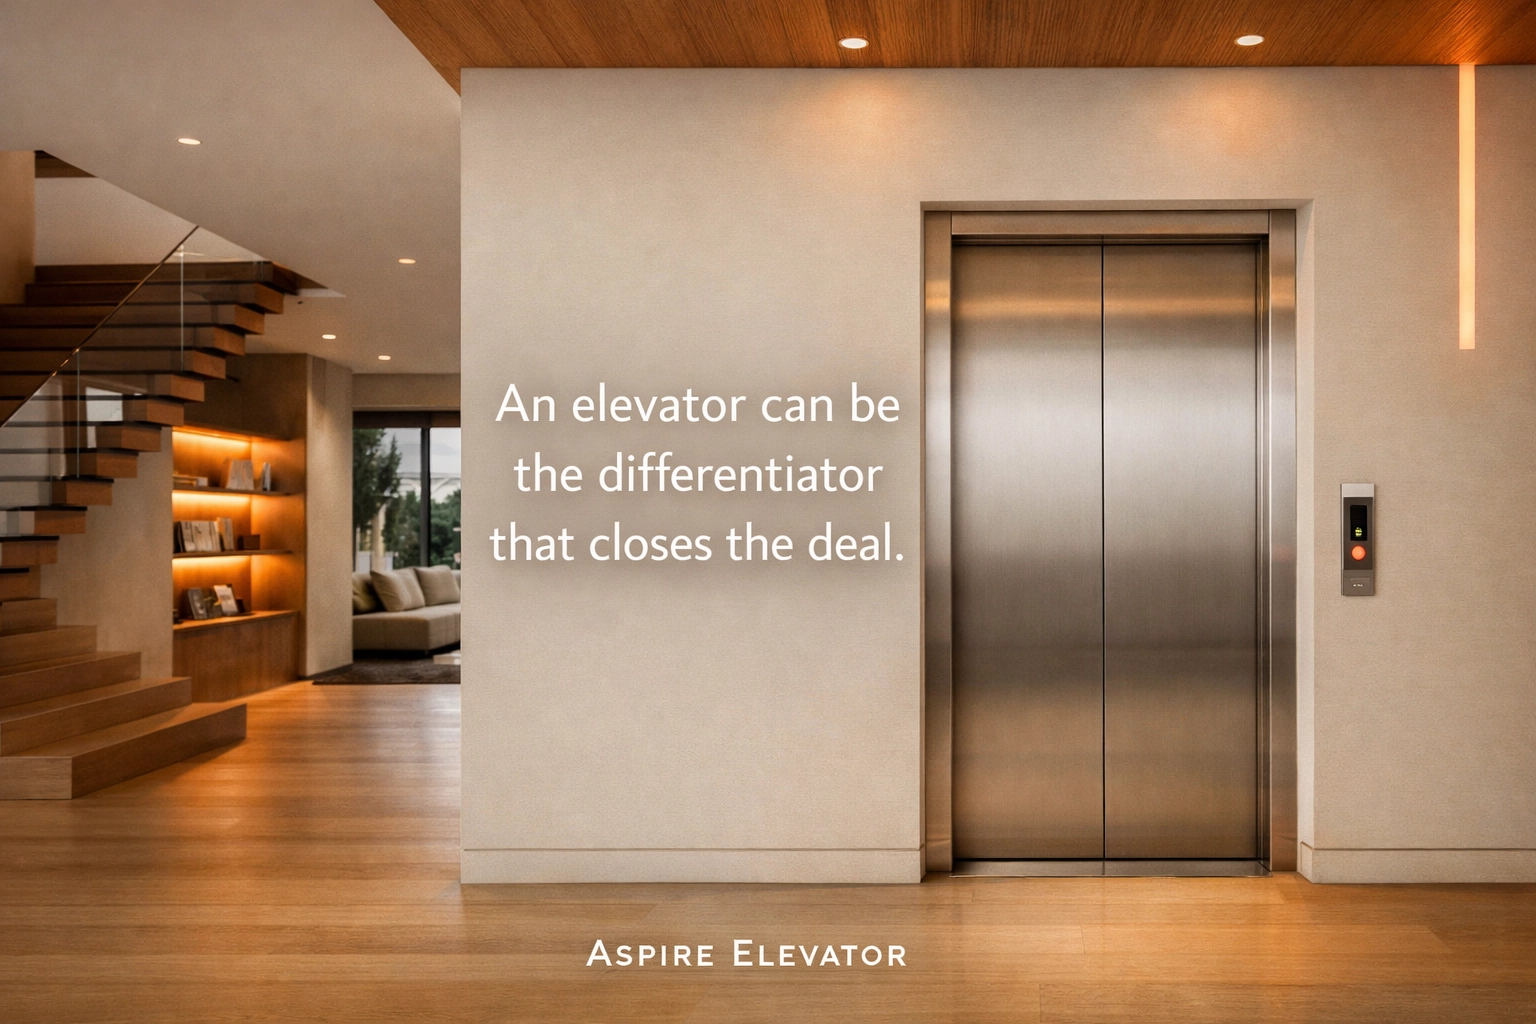
Here’s what the data shows: home elevators can increase property value by 10% to 25%, with some properties seeing value jumps of up to $67,000. That’s not a small bump: that’s a significant return on investment that few other home improvements can match.
But the financial impact goes beyond the appraisal number. Properties with elevators typically spend less time on the market and attract more qualified buyers who are willing to pay premium prices. In hot markets across the Southeast, where luxury buyers are actively searching for properties that offer something extra, an elevator can be the differentiator that closes the deal.
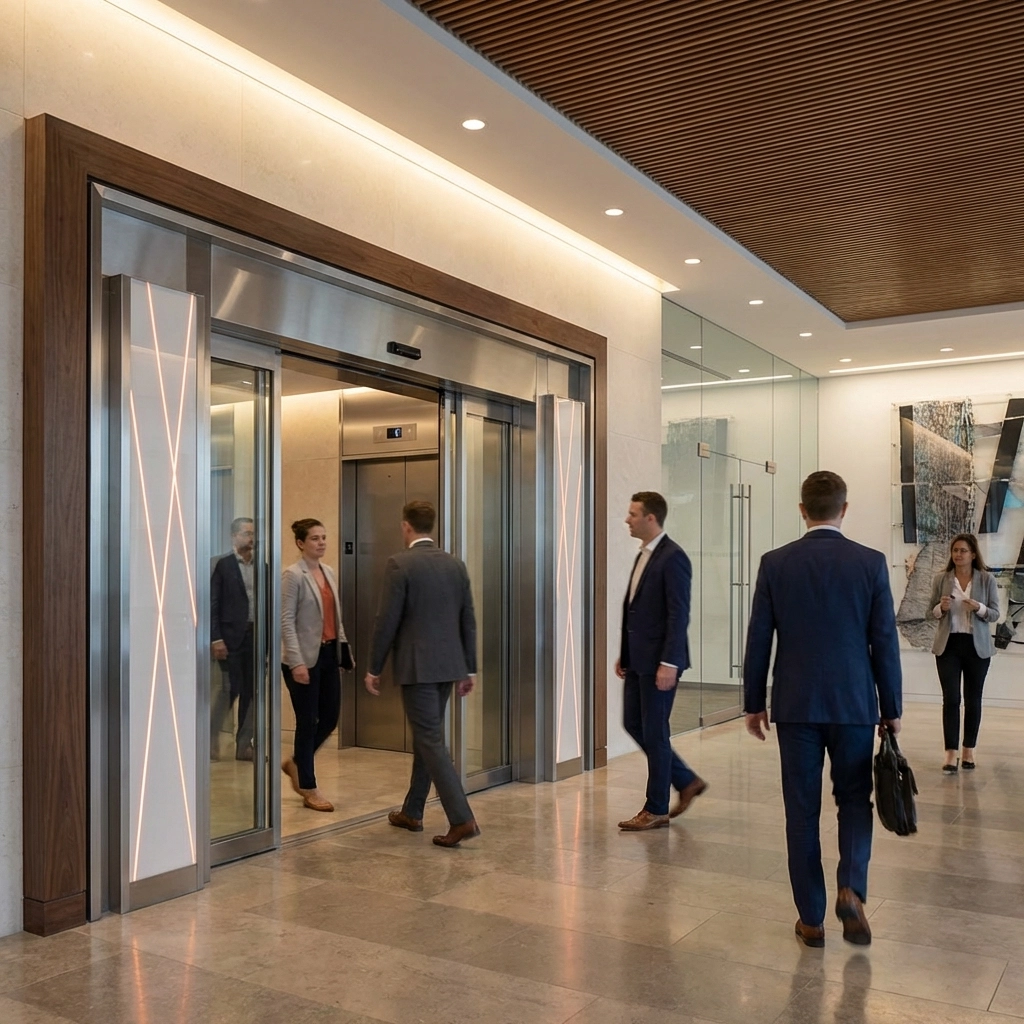
Why High-End Buyers Are Actively Seeking Elevator-Equipped Homes
Walk into any luxury real estate office in Charleston, Savannah, or Miami, and you’ll notice something: elevators are now listed as headline features, right alongside square footage and waterfront access. This shift isn’t accidental.
High-end buyers view home elevators as a mark of premium living standards. It signals that a property was designed with intention, quality, and long-term value in mind. It’s not just about moving between floors: it’s about what the feature represents: thoughtful design, future-proofing, and a commitment to lifestyle comfort.
The Psychology of Premium Features
Luxury buyers aren’t just purchasing square footage; they’re investing in lifestyle enhancements that make daily living easier and more enjoyable. An elevator communicates several powerful messages:
Forward-thinking design: The home was built or renovated with modern living in mind
Quality construction: Installing an elevator requires structural consideration and professional expertise
Aging-in-place readiness: The property accommodates changing mobility needs without future modifications
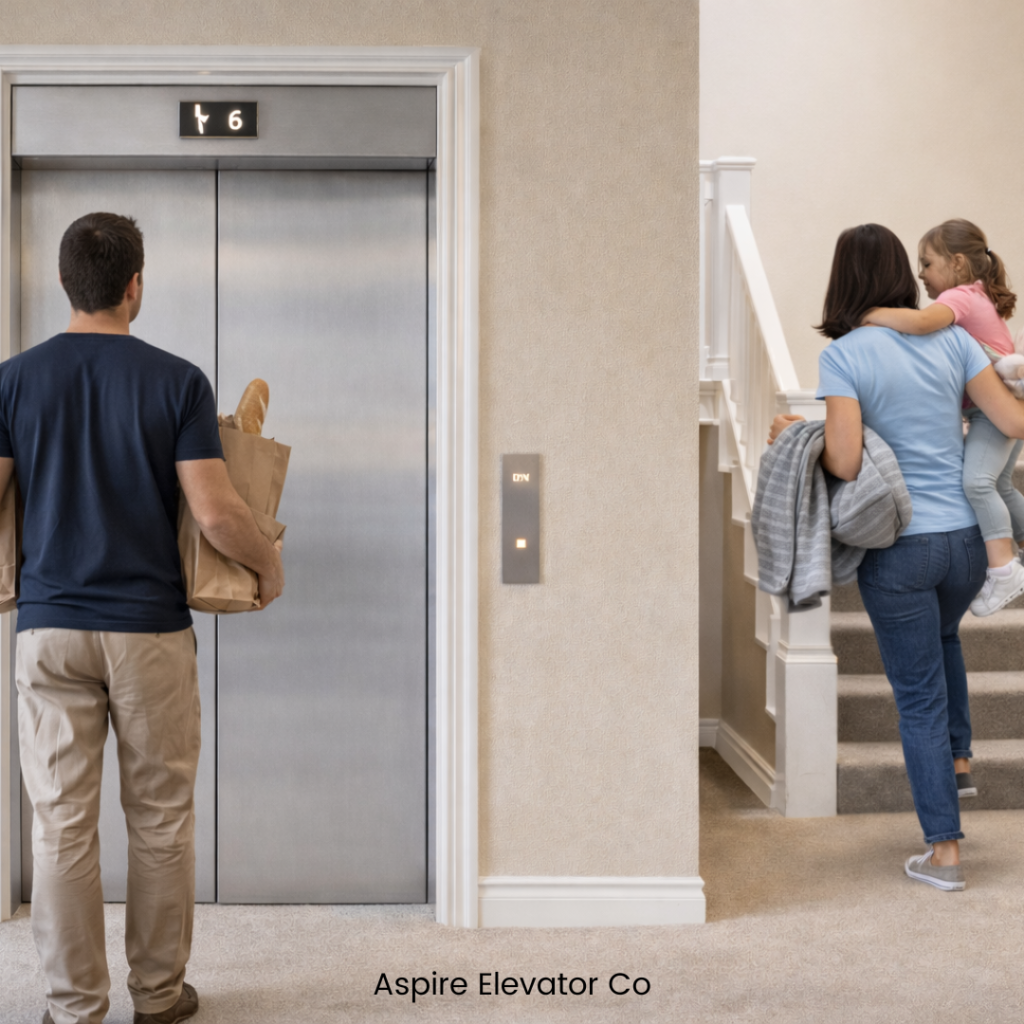
Family-friendly convenience: Moving groceries, laundry, and children between floors becomes effortless
These psychological factors translate directly into higher per-square-foot pricing compared to similar properties without elevators.
Expanding Buyer Appeal Beyond Traditional Luxury Homes
While elevators definitely attract high-end buyers, they also dramatically expand your potential buyer base across multiple demographics:
Retirees and active seniors looking at properties in Florida, Georgia, and South Carolina aren’t just planning for today: they’re planning for the next 20 years. An elevator means they can stay in their dream home without worrying about stairs becoming an obstacle.
Families with current or anticipated mobility needs immediately recognize the value. Whether it’s a family member recovering from surgery or someone managing a long-term condition, an elevator isn’t a luxury: it’s a necessity that makes your property stand out.
Young, growing families see elevators differently than you might expect. They’re thinking about hauling strollers, carrying sleeping toddlers, and managing the daily logistics of multi-story living. An elevator isn’t about inability; it’s about smart convenience.
What This Means at Listing Time
Real estate agents report that elevator-equipped homes receive more initial views and generate faster offers. The competitive advantage is real: while similar properties sit on the market for weeks, homes with elevators often move quickly because they appeal to such diverse buyer groups simultaneously.
Installation Quality: The Variable That Changes Everything
Not all elevator installations are created equal, and buyers can tell the difference. The impact on your property value depends significantly on installation quality, design integration, and ongoing maintenance.
A poorly installed elevator that feels like an afterthought won’t command the same premium as one that’s seamlessly integrated into your home’s architecture and design aesthetic. Modern options like pneumatic vacuum elevators have become particularly attractive to buyers because they:
Don’t require a machine room, reducing installation complexity
Offer energy-efficient operation
Take up minimal space with sleek, contemporary designs
Can be customized with glass panels, ambient lighting, and premium finishes
The Customization Advantage
High-end buyers expect customization options that match their home’s existing design language. When your elevator includes thoughtful details: matching finishes, integrated lighting, quality materials: it enhances perceived value far beyond the functional benefit.
Regional Market Considerations: Florida, Georgia, and South Carolina
The Southeast housing market has unique characteristics that make elevator installations particularly valuable:
Florida’s retiree-focused markets mean there’s consistent demand for age-in-place features. Properties in Naples, Boca Raton, and Jacksonville with elevators attract serious buyers who understand they’re making a long-term lifestyle investment.
Georgia’s growing luxury markets in Atlanta, Savannah, and coastal areas are seeing increased competition among high-end properties. An elevator becomes a competitive differentiator that sets your listing apart in saturated markets.
South Carolina’s Charleston and Hilton Head markets cater to both retirees and affluent families seeking second homes or permanent residences. Elevator-equipped properties in these areas command premium pricing because they address multiple buyer motivations simultaneously.
The climate across all three states also plays a role: multi-story living is common due to flood considerations and architectural preferences, making elevators practical additions rather than unusual luxuries.
Practical Steps: What You Need to Know Before Installation
If you’re considering an elevator installation to maximize property value, here’s what matters:
Start with a professional assessment: Your home’s structure, available space, and design will determine which elevator type works best. Modern residential elevators come in various configurations, from traditional cable-driven systems to space-efficient pneumatic options.
Think about design integration: Work with installers who understand that aesthetic matters as much as function. The elevator should feel like it was always part of your home’s design, not an obvious addition.
Prioritize quality and warranties: Buyers will ask about installation date, warranty coverage, and maintenance history. Premium installations with comprehensive warranties command higher values because they represent peace of mind.
Maintain documentation: Keep detailed records of installation, inspections, and maintenance. This documentation becomes valuable during the sales process, demonstrating that the elevator has been properly cared for.
The Appraisal Factor: How Elevators Are Valued
During property appraisal, elevators are evaluated based on several factors:
Installation quality and integration: How well does it fit the home’s design and structure?
Maintenance history: Has it been properly serviced and documented?
Type and features: Modern, energy-efficient systems with premium finishes value higher
Market comparables: What similar properties with elevators have sold for in your area
Appraisers recognize that elevator-equipped homes appeal to broader markets and typically assign value accordingly. In markets where aging-in-place features are in high demand, the valuation impact is even more pronounced.
Making the Investment Decision
Installing a home elevator represents a significant investment, but the financial return combined with lifestyle benefits makes it one of the smarter upgrades for multi-story homes. Unlike trendy kitchen backsplashes or bathroom fixtures that may fall out of style, elevators address fundamental needs that remain relevant regardless of design trends.
Consider this: you’re not just adding a feature: you’re repositioning your property in the market. You’re moving from competing with standard multi-story homes to competing with luxury properties that prioritize accessibility, convenience, and forward-thinking design.
Ready to Explore Your Options?
If you’re serious about maximizing your property value and positioning your home to attract high-end buyers in Florida, Georgia, or South Carolina, it’s worth having a conversation about what a residential elevator could mean for your specific property.
At Aspire Elevator Co., we specialize in helping homeowners understand their options, navigate the installation process, and select elevator solutions that align with both their current needs and future property goals. We focus on transparent pricing, quality installations, and ongoing support that protects your investment.
Get in touch with our team to discuss your property’s potential. We’ll walk you through design options, answer questions about ROI, and help you understand exactly what an elevator installation could mean for your home’s market position.
Your property’s next competitive advantage might just be one conversation away.
Whether you manage a commercial high-rise in Atlanta or own a private residence with a home elevator in Jacksonville, routine safety inspections are non-negotiable. They protect your tenants, your family, and your investment.
But here’s the reality: most elevator problems don’t appear out of nowhere. They develop over time: and they’re often preventable with the right maintenance approach.
In this guide, we’ll walk through the seven most common issues uncovered during elevator safety inspections across Florida, Georgia, and South Carolina. More importantly, we’ll show you exactly how to prevent them before they become costly repairs or compliance violations.
Why Elevator Safety Inspections Matter
Elevator inspections aren’t just a regulatory checkbox. They’re your first line of defense against equipment failures, liability issues, and unexpected downtime. For property managers, a failed inspection can mean taking an elevator offline: disrupting tenants and operations. For homeowners, it can mean safety risks for your family and guests.
The good news? Most inspection failures stem from a handful of recurring issues. Address these proactively, and you’ll stay ahead of problems instead of reacting to them.
Issue #1: Failed Emergency Car Lighting
What inspectors find: Emergency lighting systems inside the elevator cab fail to activate during power outages. This happens because backup batteries degrade over time and aren’t replaced on schedule.
Why it matters: If your elevator loses power and the emergency lights don’t work, passengers are stranded in complete darkness. Beyond the safety hazard, failed emergency systems are an immediate inspection failure in most jurisdictions.
How to prevent it:
Replace emergency lighting batteries at manufacturer-recommended intervals (typically every 1–3 years)
Include emergency lighting tests in your quarterly inspection checklist
Document all battery replacements in your maintenance log
Issue #2: Inadequate Machine Room Lighting
What inspectors find: Machine rooms and elevator pits lack sufficient lighting, or existing lights aren’t accessible from the room entrance. This creates hazards for technicians performing maintenance.
Why it matters: Poor lighting in mechanical spaces leads to accidents, missed maintenance issues, and code violations. Inspectors check that lighting meets specific lumen requirements and is easily accessible.
How to prevent it:
Schedule monthly visual inspections of machine room lighting
Verify that light switches are located at room entrances
Replace burned-out bulbs immediately: don’t wait for inspection day
Issue #3: Malfunctioning Door Restrictors
What inspectors find: Door restrictors: the safety devices that prevent elevator doors from opening when the cab isn’t at a landing: fail to operate correctly. This is one of the most serious safety violations an inspector can identify.
Why it matters: A malfunctioning door restrictor can allow doors to open into an empty shaft. In many states, elevators with failed door restrictors must be immediately removed from service until repairs are completed.
How to prevent it:
Test door restrictors monthly as part of routine maintenance
Monitor for any hesitation, unusual sounds, or alignment issues
Schedule professional inspections if you notice any irregularities
Issue #4: Door System Problems
What inspectors find: Elevator doors that don’t open or close smoothly, get stuck, or reverse inconsistently. These issues typically stem from misaligned sensors, dirty door tracks, or worn mechanical components.
Why it matters: Door problems are among the most frequently reported elevator issues. They frustrate users, slow building traffic, and often indicate deeper mechanical concerns that will worsen over time.
How to prevent it:
Clean door tracks thoroughly and regularly
Calibrate door sensors according to manufacturer specifications
Address any jerking, hesitation, or unusual door behavior immediately
Schedule professional sensor recalibration at least annually
Issue #5: Unusual Noises and Vibrations
What inspectors find: Grinding, rattling, squeaking, or thumping sounds during elevator operation. These noises often indicate misaligned components, loose parts, or insufficient lubrication.
Why it matters: Unusual sounds aren’t just annoying: they’re early warning signs. Left unaddressed, minor mechanical issues can escalate into major repairs or sudden breakdowns. Inspectors note these conditions and may require follow-up maintenance.
How to prevent it:
Train building staff to report unusual elevator sounds immediately
Include listening checks in monthly visual inspections
Maintain proper lubrication schedules for all moving components
Don’t ignore small noises: investigate them promptly
Issue #6: Erratic Movement and Power Failures
What inspectors find: Elevators that stop unexpectedly, move erratically between floors, or fail to respond to controls. These problems often involve control system malfunctions, electrical issues, or mechanical failures in pulleys, counterweights, or braking systems.
Why it matters: Erratic elevator behavior creates immediate safety concerns and significant liability exposure. Power failures can strand passengers and disrupt building operations for hours.
How to prevent it:
Conduct quarterly comprehensive inspections that include:
Testing all safety systems
Checking cable tension
Inspecting motor and drive components
Evaluating electrical connections
Verify backup power systems (generators, battery backups) are functional
Keep detailed maintenance logs to identify patterns before failures occur
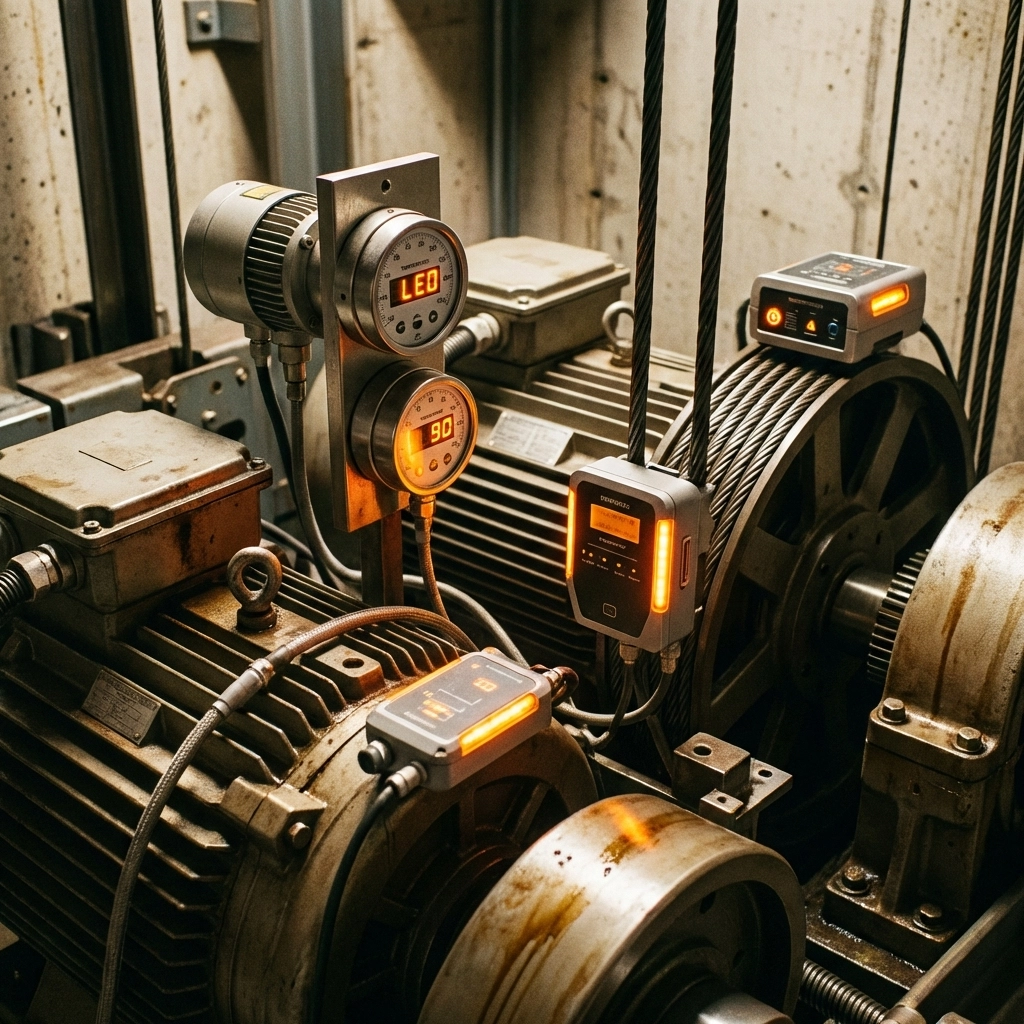
Issue #7: Overheating Components
What inspectors find: Motors, cables, bearings, or control systems running at elevated temperatures. Overheating is especially common during high-usage periods in commercial buildings.
Why it matters: Overheating components can trigger system shutdowns, accelerate wear, and in extreme cases, create fire hazards. This issue often goes unnoticed until it causes a breakdown.
How to prevent it:
Ensure machine rooms have adequate ventilation
Maintain proper lubrication levels on all bearings and moving parts
Consider thermal imaging inspections to detect hot spots before they cause problems
Replace worn components promptly: don’t push equipment past its service life
Building Your Prevention Strategy
Preventing these seven issues comes down to three fundamentals:
1. Establish a consistent maintenance schedule
Monthly visual inspections for obvious issues (lighting, sounds, door operation)
Quarterly comprehensive inspections covering all mechanical and electrical systems
Annual professional assessments with certified technicians
2. Document everything Maintain a detailed maintenance log that tracks inspections, repairs, and component replacements. This documentation helps you predict when parts need attention and demonstrates compliance during inspections.
3. Work with certified professionals Elevator systems are complex. Attempting DIY repairs or inspections can disable critical safety functions and create liability. Partner with experienced, certified elevator professionals who understand state and local codes in Florida, Georgia, and South Carolina.
The Bottom Line
Elevator safety inspections don’t have to be stressful. When you understand the most common issues: and take proactive steps to prevent them: you’ll pass inspections with confidence, avoid costly emergency repairs, and keep your elevators running safely for years to come.
The key is consistent, professional maintenance from a team that knows your equipment and your local requirements.
Ready to Schedule Your Inspection?
At Aspire Elevator Co., we provide comprehensive elevator inspection, maintenance, and repair services for commercial properties and residential elevators throughout Florida, Georgia, and South Carolina. Our certified technicians deliver transparent pricing, no hidden fees, and responsive service you can count on.
Whether you need a routine inspection, preventive maintenance program, or help addressing a specific issue, we’re here to help.
Call us today to schedule your elevator safety inspection or discuss a maintenance plan tailored to your property.
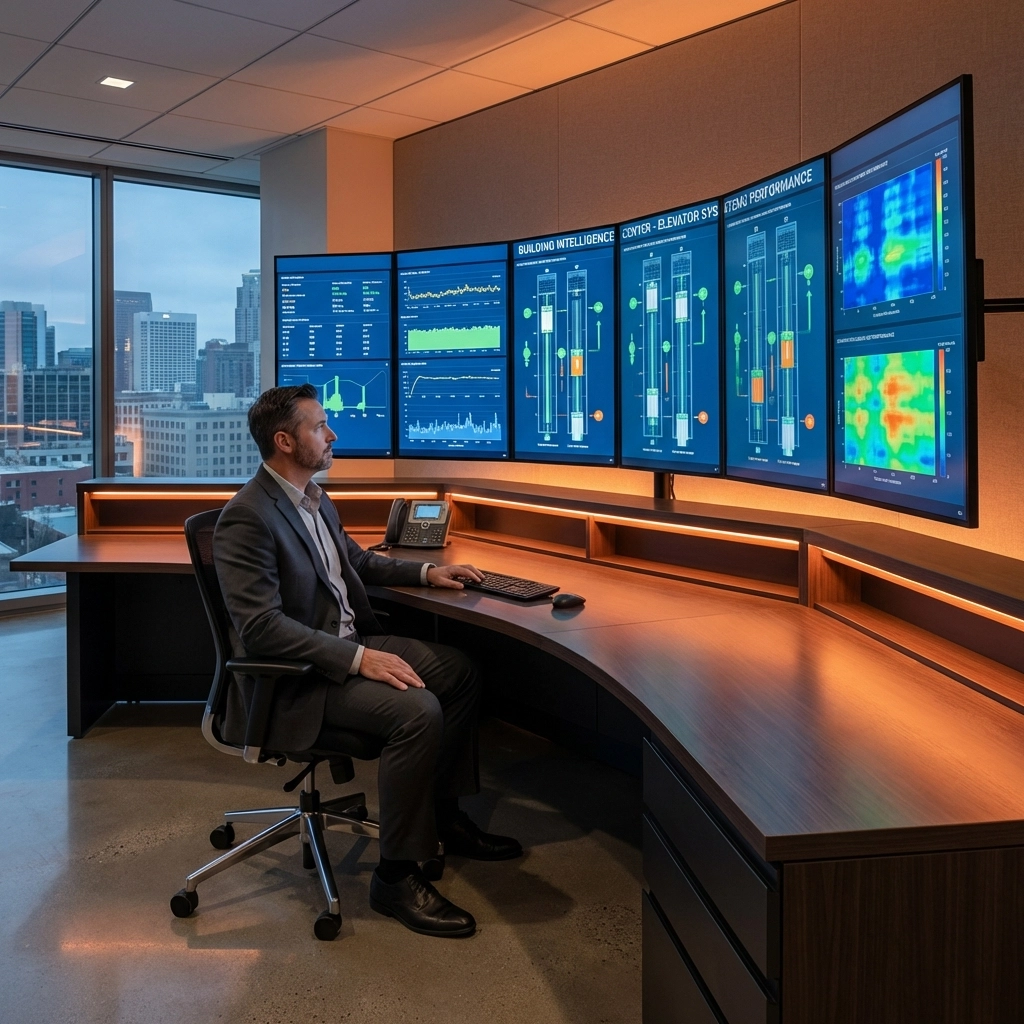
Commercial elevator downtime costs the average building $2,500 per hour in lost productivity and tenant satisfaction. With modern monitoring technology, property managers can now prevent 85% of elevator failures before they occur. Here are the five essential monitoring tools that are transforming commercial elevator management in 2026.
1. Remote Monitoring Systems with Real-Time Analytics
Remote monitoring platforms have become the backbone of proactive elevator maintenance. These systems track performance metrics 24/7 and instantly alert facility teams when anomalies occur.
Key Features:
Real-time performance tracking across all elevator systems
Automatic fault detection and immediate notifications
Historical data analysis for usage pattern identification
Integration with building management systems (BMS)
Why It Matters: Remote monitoring reduces emergency service calls by 60% and extends elevator lifespan by identifying wear patterns before they cause failures. The BBX VISIBLE IoT Platform exemplifies this technology, offering comprehensive oversight for high-rise buildings with detailed dashboard analytics.
Implementation Benefits:
Immediate notification of mechanical faults
Reduced response times from hours to minutes
Predictive insights that prevent costly breakdowns
Detailed reporting for maintenance planning and budgeting
Property managers using remote monitoring report average maintenance cost reductions of 25-35% within the first year of implementation.
2. AI-Driven Predictive Maintenance Systems
Artificial intelligence has revolutionized how we approach elevator maintenance. Advanced sensor networks collect data on motor temperatures, door operations, vibration patterns, and cable tension, feeding this information into AI algorithms that predict failures weeks in advance.
Core Capabilities:
Motor temperature and performance analysis
Door operation cycle monitoring
Vibration pattern recognition
Cable wear and tension assessment
Digital twin simulation for scenario planning
Proven Results: AI-driven systems are reducing elevator downtime by more than 30% across commercial installations globally. These platforms use machine learning to continuously improve their predictive accuracy, becoming more effective over time.
Strategic Advantages:
Schedule maintenance during off-peak hours
Order replacement parts before failures occur
Eliminate surprise breakdowns during critical business periods
Optimize technician schedules and resource allocation
The technology pays for itself through reduced emergency calls and extended component life, typically showing ROI within 18 months.
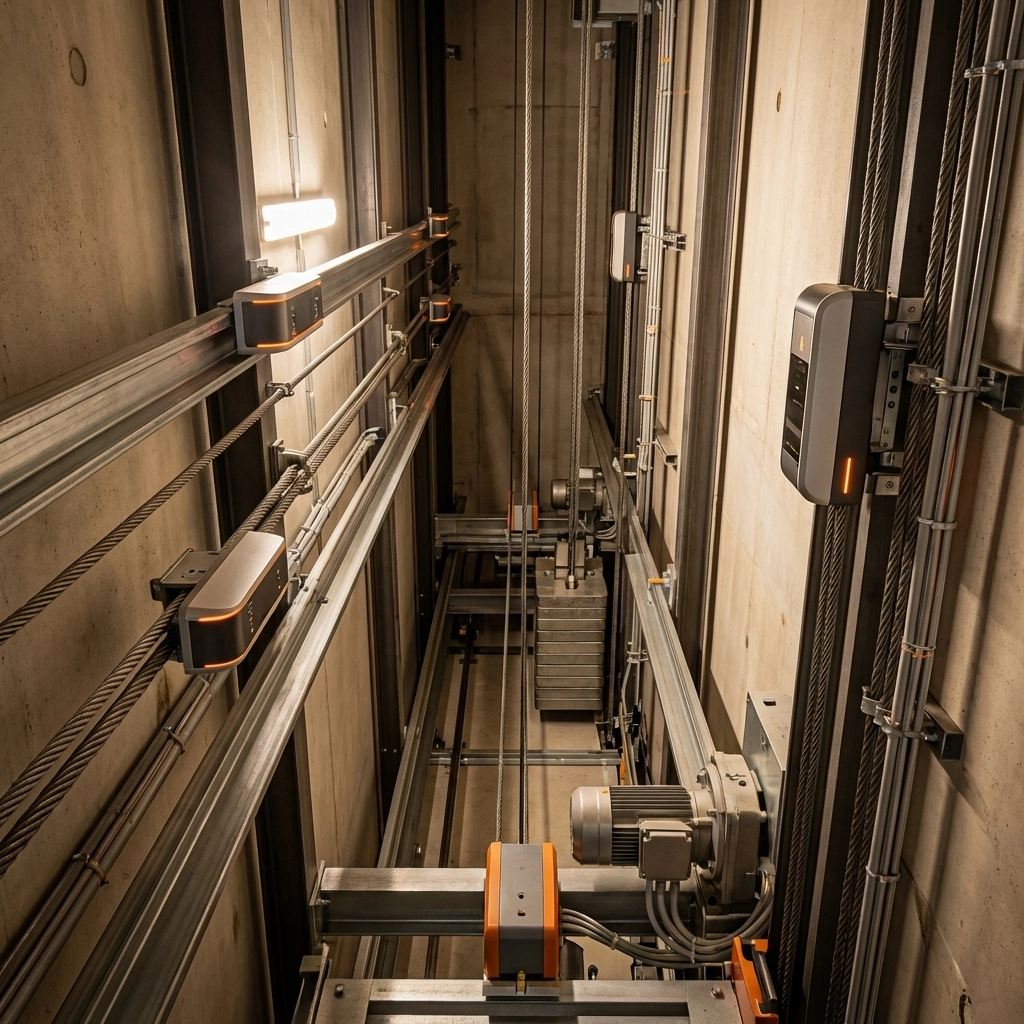
3. Smart Sensor Networks for Comprehensive Diagnostics
Modern elevator monitoring relies on strategic sensor placement throughout the elevator system. These sensors provide granular data on every aspect of elevator performance.
Essential Sensor Types:
Motion sensors: Track acceleration, deceleration, and travel smoothness
Temperature sensors: Monitor motor, brake, and control room conditions
Vibration sensors: Detect bearing wear, alignment issues, and mechanical stress
Load sensors: Measure car weight distribution and usage patterns
Door sensors: Monitor opening/closing cycles and obstruction detection
Data Collection Benefits: Smart sensors create a complete picture of elevator health, enabling maintenance teams to address minor issues before they escalate. This comprehensive monitoring approach reduces major repair costs by 40-50%.
Implementation Strategy: Start with critical sensors on high-traffic elevators, then expand coverage based on usage patterns and risk assessment. Prioritize sensors that monitor the most failure-prone components: doors, motors, and control systems.
4. 3D Multi-Beam Door Safety and Monitoring Systems
Door-related issues account for 60% of elevator service calls in commercial buildings. Advanced 3D multi-beam sensors address this challenge while providing valuable monitoring data.
Technology Advantages:
Earlier movement detection reduces false stops
Better performance in high-traffic environments
Reduced wear on door mechanisms
Enhanced passenger safety and comfort
Detailed usage analytics for traffic optimization
Ideal Applications:
Shopping malls and retail centers
Airports and transportation hubs
Hospitals and healthcare facilities
Office buildings with heavy foot traffic
Hotels and hospitality venues
Performance Impact: Buildings using 3D multi-beam sensors report 45% fewer door-related service calls and 20% improvement in passenger wait times during peak periods.
Cost Considerations: While initial investment is higher than traditional sensors, the reduction in service calls and improved passenger experience typically yields ROI within 2-3 years.
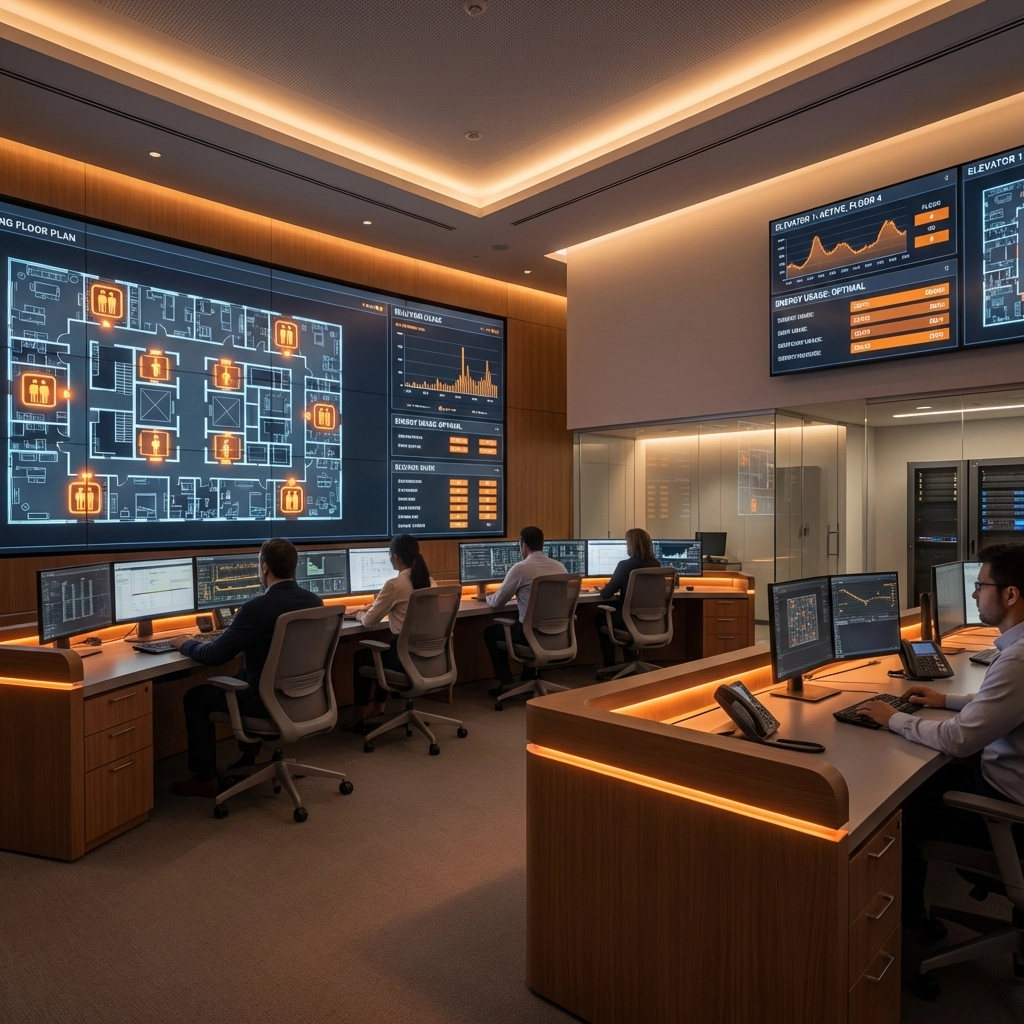
5. IoT-Enabled Building Integration Platforms
Internet of Things (IoT) technology connects elevator monitoring to broader building management systems, creating unified facility oversight.
Integration Capabilities:
Real-time dashboard updates for building operations teams
Automated reporting for compliance and maintenance records
Integration with access control and security systems
Energy usage monitoring and optimization
Tenant notification systems for planned maintenance
Operational Benefits: IoT platforms enable property managers to monitor elevator performance alongside HVAC, lighting, and security systems from a single interface. This integration improves response coordination and reduces operational complexity.
Key Features:
Mobile app access for remote monitoring
Automated maintenance scheduling
Vendor management and service coordination
Compliance documentation and reporting
Energy efficiency tracking and optimization
Maximizing Your Monitoring Investment
Start with High-Impact Areas: Focus initial monitoring investments on elevators with the highest traffic or most critical to building operations. This approach maximizes immediate benefits while building experience with the technology.
Plan for Integration: Choose monitoring tools that integrate with existing building systems and can scale as your portfolio grows. Avoid vendor lock-in by selecting platforms with open APIs and industry-standard protocols.
Staff Training Requirements: Ensure your maintenance team receives proper training on monitoring platforms. Most property managers see optimal results when at least two team members are fully trained on each system.
Performance Metrics to Track:
Average downtime per elevator per month
Preventive vs. reactive maintenance ratio
Tenant satisfaction scores
Energy consumption per elevator
Total cost of ownership including monitoring systems
Implementation Timeline and ROI Expectations
Most comprehensive monitoring implementations take 3-6 months from planning to full operation. Property managers typically see measurable improvements within 90 days, with full ROI within 18-24 months.
Phase 1 (Months 1-2): System selection, vendor negotiations, and installation planning Phase 2 (Months 2-4): Hardware installation and system integration Phase 3 (Months 4-6): Staff training and process optimization
The combination of reduced downtime, lower maintenance costs, and improved tenant satisfaction creates compelling business value that justifies the investment in monitoring technology.
For commercial properties seeking to implement comprehensive elevator monitoring solutions, professional guidance ensures optimal system selection and integration. The right monitoring strategy transforms elevator management from reactive maintenance to proactive optimization, delivering measurable improvements in performance, cost control, and tenant satisfaction.
Modern elevator monitoring isn’t just about preventing breakdowns; it’s about optimizing building operations and creating superior tenant experiences through reliable, efficient vertical transportation systems.
Ready to reduce downtime and improve tenant satisfaction? Contact Aspire Elevator Co. for expert monitoring solutions or to schedule a consultation.
Welcome to the Aspire Elevator Blog, where we delve deep into the world of elevators and escalators. Our goal is to keep you informed about the latest trends, innovations, and safety standards that shape the elevator industry. Whether you’re a professional in the sector or simply an enthusiast, our blog is designed to provide valuable insights and knowledge.
Expert Articles and Reader Discussions
We feature a range of expert-written articles that explore various topics, including emerging technologies and maintenance tips for elevator systems. We encourage reader participation through discussions, allowing you to share your thoughts and experiences. This collaborative approach fosters a vibrant community where industry professionals and curious readers can engage and learn from one another.
Elevator Technology and Company Updates
In addition to our articles, stay tuned for updates on Aspire Elevator Company news, product launches, and service enhancements. Our commitment to safety and innovation is at the forefront of our operations, and we are excited to share our journey with you. Don’t forget to check back regularly for insights into elevator technology and maintenance tips that can help you maximize the efficiency and safety of your elevator systems.
We appreciate your interest in the elevator sector and hope you find our blog beneficial. For more information about our services, visit www.aspireelevator.com.


![[HERO] Selling Power: How Installing a Home Elevator Can Increase Your Property Value and Attract High-End Buyers](https://cdn.marblism.com/TVUww5Fv-tb.webp)